
Google Analytics and Google Tag Manager debugging is a complicated topic, full of technical nuances (and sometimes hours of frustration). While I do not claim to be an expert in this topic, I want to share some points and techniques I’ve learned and am using myself.
I will try not to go into much technical details, rather outline the process and, to my mind, key points, tools and techniques. I will also cover only the most basic tasks and cases, no e-commerce, cross domain, iframe and other complex cases (maybe there will be part 2 later for that).
How web analytics work
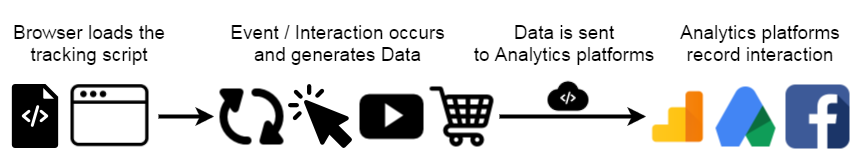
To start, let’s review how web analytics work in general.
Once the browser requests the page, it gets loaded with all the content such as texts, images and, if present, analytics scripts. If you place tracking scripts like Google Analytics or Facebook pixel directly in the website code, once they get loaded, they will send a signal (request) to own platforms with the information on a loaded page, such as page URL, and pageview event. With page load it usually happens automatically, while later interactions on the page, like video views, page scroll or link clicks, need to be additionally configured to trigger other requests with new data.
Debugging process
In order to test and learn if all the tracking works correctly, I would split the process into several steps. In the real-life, you may skip some steps or check them in a different order, while for the purpose of this article I will cover them subsequently.
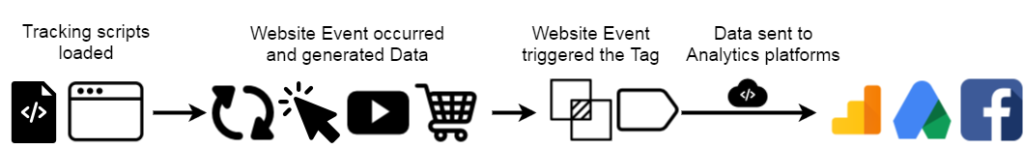
1. Tracking scripts present in the code and loaded correctly
2. Website Event occurred and generated Data
3. Website Event triggered the Tag
4. Data sent to Analytics platforms
1. Tracking scripts present in the code and loaded correctly
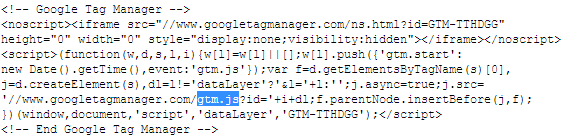
Often tracking library – JavaScript (.js) file – needs to be loaded prior to any tracking calls. For example, Google Tag Manager requires gtm.js to run, Google Analytics – analytics.js, Facebook – fbevents.js, Twitter – uwt.js. It can be easily seen when you copy the tracking code.
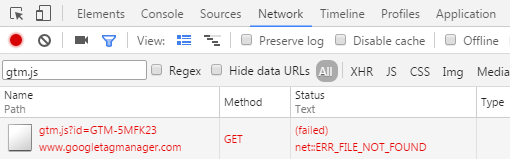
Since they are usually loaded with an almost immediate pageview hit, you can use different Chrome plugins to debug – I will come back to it in a while. If to pretend we are now only interested in those JavaScript libraries, I would suggest to go for Chrome Developer Tools ( F12 or right mouse click and “Inspect” option), Network tab. It shows all the resources requested and loaded by the browser like images, JavaScript and CSS files as well as various other hits and requests. As now we are only interested in the particular .js files – we can use the search/filter box and see if they are successfully loaded. Status should be either 200 (ok), or 3xx. In the example below: 307 – temporary redirect to the https destination with the analytics.js and later 304 – file was successfully loaded before and taken from browser cache, since it was not modified. You can read more about HTTP statuses here.
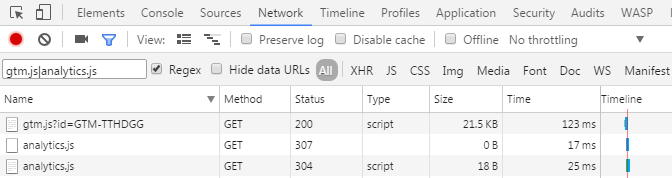
You will also see many different interesting things, like file size, load speed and load timeline. By clicking on the first column you can get detailed data on the specific request, including header sent and reply received.
If you see different response statuses or no lines at all – tracking codes are either not implemented in the source code (poke the IT) or contain errors (inspect the Source Code and check if the tracking code is copied correctly).
Frequent issue
Very frequent error case – GTM returns an error when contains no published Tags. Just publish new GTM version with Tags and the error should disappear.
Tag Assistant Chrome extension is especially good for Google Analytics and GTM debugging as it shows many additional information and errors.
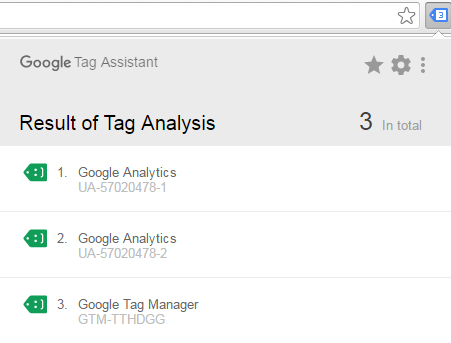
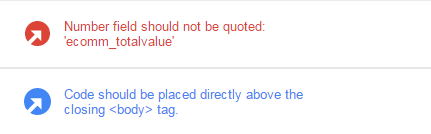
Since all the Tags are green – all is ok. Blue icons require attention – often they contain recommendations that could be followed, while sometimes may be ignored as well. You should really be looking for red icons, as they represent critical errors that impact data collection.
You can click on a tag to get more information about it or learn more about the error. Here is a nice short video explaining basic Tag Assistant possibilities.
You are currently viewing a placeholder content from YouTube. To access the actual content, click the button below. Please note that doing so will share data with third-party providers.
To check the presence of Google Analytics, Google Tag Manager or few other Google services across all the website pages you can use www.gachecker.com.
Also it is always good to check the Chrome DevTools Console for any JavaScript errors that may impact tracking.
2. Website Event occurred and generated Data
Now as we are sure all the tracking libraries are present and loaded, we need to make sure they can track the desired user actions. Here I will focus mostly on Google Tag Manager implementation, due to the conveniency and possibilities GTM brings.
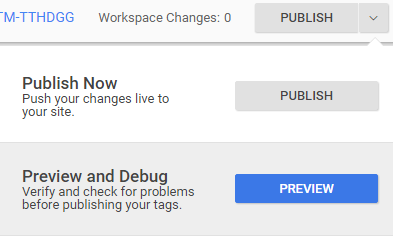
All the events Google Tag Manager identifies appear in the left sidebar of the Preview and Debug Mode console. Enable it in the GTM interface and reload the website to see the console.
One of the events available by default is page load or Page View, triggered by gtm.js library load, along with 2 more events – DOM Ready (all element loaded, while some scripts and images may still be loading) and Window Loaded (page fully loaded).
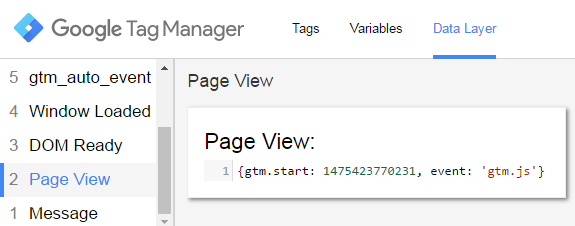
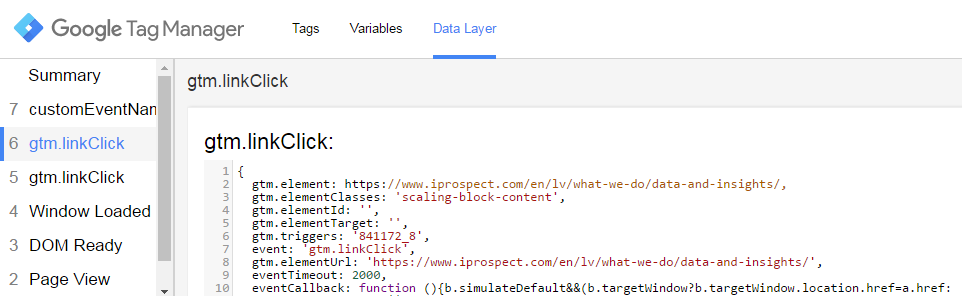
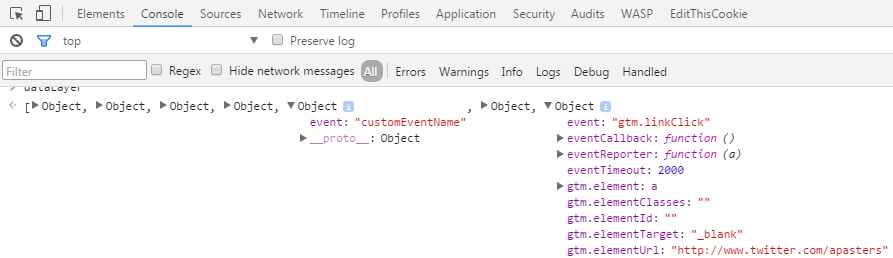
As for the other events, they need to be configured with a help of GTM listeners – functions that “listen” for some specific actions. They could be built-in, like for clicks (events 5-6 in the image below) or custom (7), sent by placing dataLayer.push({‘event’:’customEventName’}); in the code.
Data Layer tab shows the information being sent along with the event, adding new or rewriting existing Variables – tab on the left. If you see no needed Variable or value with the information sent in the dataLayer, check if you have a Variable created in GTM or if it works as intended.
Frequent issue
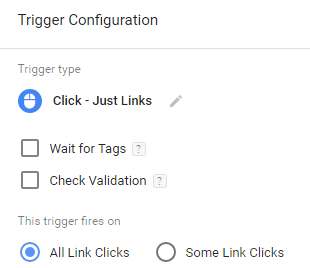
If you want to track link clicks (<a></a>elements), added Click Trigger to listen for all link clicks and by clicking on the link see no gtm.linkClick event, there is either a problem with GTM Trigger setup (wrong filters, or maybe just previewing old version) or the Trigger is being blocked by JavaScript. You should check the JavaScript functions for event.stopPropagation(); or return false; that block GTM listeners. Or ask the IT to check and change all to event.preventDefault(); that won’t “break” GTM listeners.
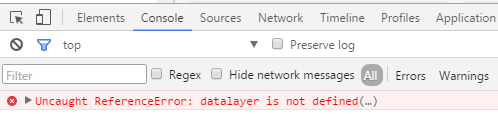
If you asked the developers to implement custom event dataLayer.push({‘event’:”}); and see no events in GTM sidebar on the interaction – again, either it is not implemented in the website, or is implemented with errors. Here it is always good to check the Chrome DevTools (F12) Console Errors section. If there is an error, you will also get the file and the line number where to look for the code. In this example, the code has datalayer.push() instead of dataLayer.push(). Since JavaScript is a case sensitive language and there are no objects called “datalayer” – browser returns an error.
If you have no access to GTM and can’t turn the preview console, you can check the dataLayer in the same Chrome Console. Just type dataLayer and press Enter. You will see all the dataLayer objects – click on them to see more data. You won’t see the Variables, since they are generated on the GTM side, but still see what kind of data are being generated by the page and sent to Google Tag Manager.
3. Website Event triggered the Tag
Now as we made sure all events are present and working, let’s see if they are triggering Tags. Again, with GTM console it’s very easy to test.
When you click on the event – you see Tags triggered for this particular event and also all others that did not.
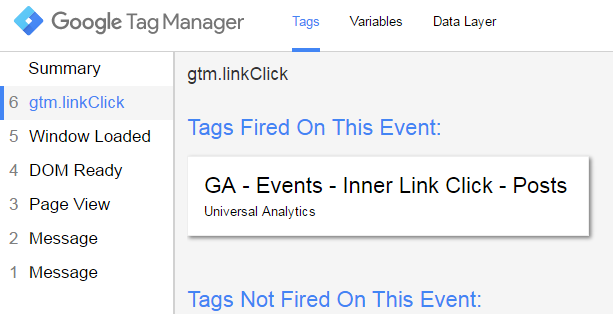
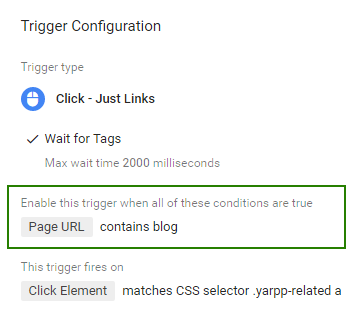
You can click on any Tag and see why did they fire or why not. In the example below, “GA – Events – Inner Link Click – Post ” Universal Analytics Tag was successfully fired as it passed all the conditions of the ““Link Click – Post Inner Links” Trigger.
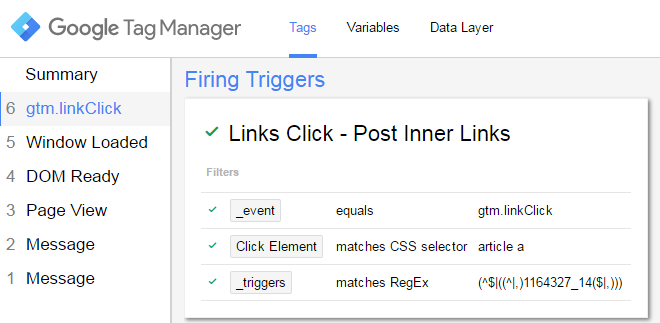
While “GA – Events – Inner Link Click – Posts” Tag was not fired, as it did not match the Click Element condition of the “Link Click – Post Inner Links” Trigger, as it should not have.
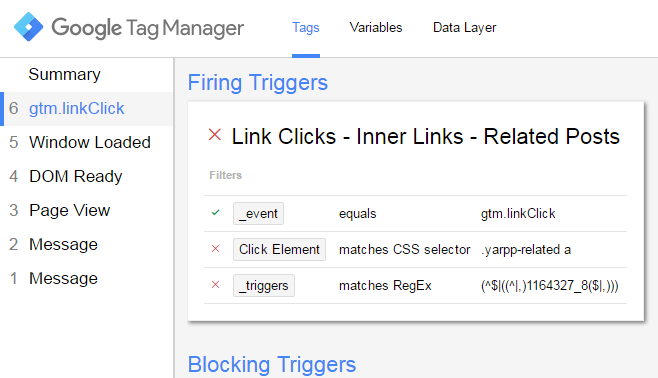
There is also one more condition that did not match – _triggers – that has a strange set of characters. This is the “Enable this trigger” condition for Triggers with “Wait for Tags” or “Check Validation” options selected. As the condition in the console does not help much (don’t ask why), go to GTM account to check it.
Make sure you check also “Blocking Triggers”, under the “Firing Triggers” section.
4. Data sent to Analytics platforms
This is possibly the most important and frequent step. Actually, you may often start with it and go for previous steps only if something will be wrong.
Analytics platforms get data from hits or requests sent by the tracking scripts. There are many ways to view these requests, for example you can use different plugins like Tag Assistant (for Google tracking), Facebook Pixel Helper (Facebook pixels), Tag Explorer or WASP (all requests and tracking codes) .
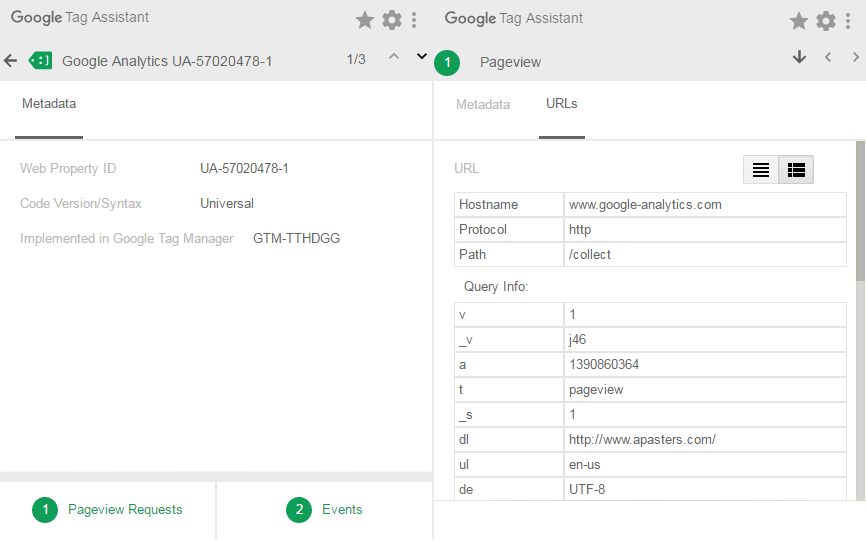
Tag Assistant gives you an overview of the requests sent that you can click on and browse more detailed info. There is also an option to record all the interactions and requests, to view them afterward in a single view.
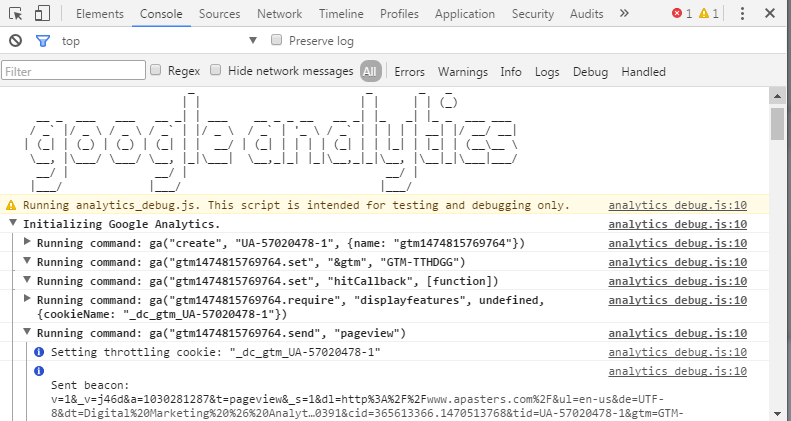
Google Analytics Debugger is one more must-have tool for Google Analytics debugging. Once you enable it – go to Chrome DevTools (F12) Console and you will see various information on Google Analytics.
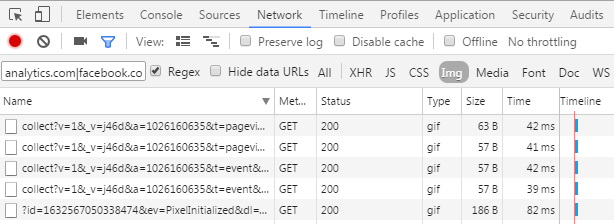
If you don’t have any plugins installed or debugging any other analytics platforms, you can go to the same Chrome DevTools (F12) Network tab and see all the requests sent. Again, clicking on the name column you can get more detailed view. If the action you want to track reloads the page, don’t forget to enable “preserve log” to view the data afterwards.
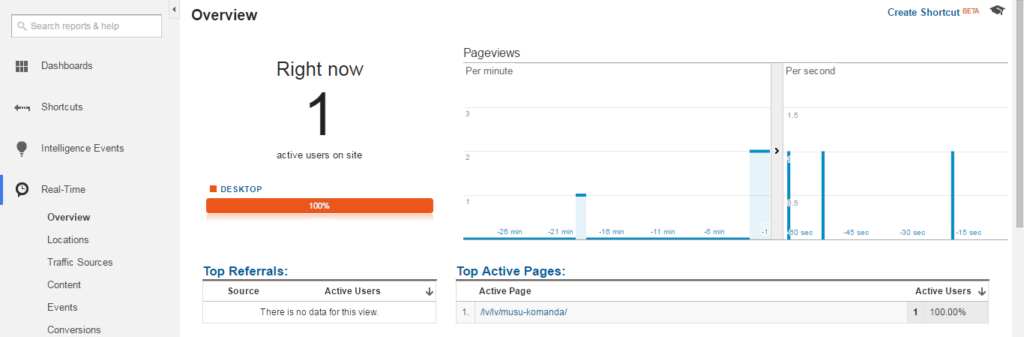
If debugging Pageviews or Events, they also could be seen in the Google Analytics real-time reports. Otherwise you may need to wait at least several hours to see if the data was received and recorded by Google Analytics.
If you understand how tracking works and where to look, you should be able to follow the process described and easily find possible issues or make sure that all works as intended.
Have other techniques or tools for debugging? Or have any questions? Please share in the comments below or via social networks.
To end, here are some other useful articles on Google Analytics and Google Tag Manager debugging: